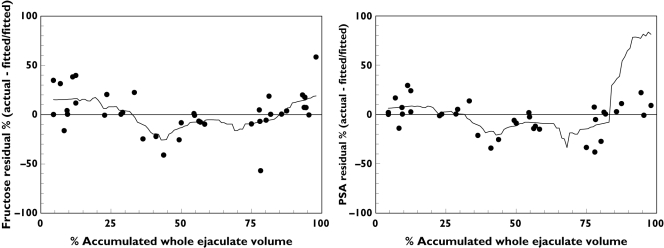
Figure 6.
Residual plots of fructose-PSA linear regression for cohort D. The residual percent is defined as the residual value (actual – fitted value) as a percent of the fitted value. The residuals and fitted values are taken from separate fructose vs. PSA linear regressions where each marker was the dependent variable. The x-axis values are the midpoints of the percent of accumulated whole ejaculate volume represented by each of the fractions. Trend lines are smoothed using the inverse square method with 20% sampling

