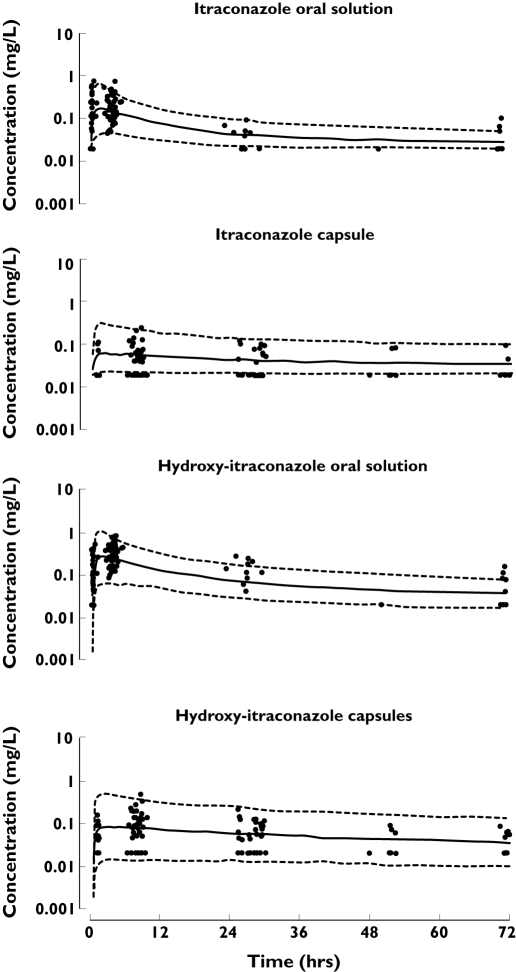
Figure 4.
Observed itraconazole and hydroxy-itraconazole plasma concentrations [•, not below the limit of detection (BLOD), ✗, BLOD] (mg l−1), 5% and 95% prediction intervals (---) of simulated data as well as the median value ( ) of the simulated data for both capsules and oral solution after a single dose

