
Figure 1.
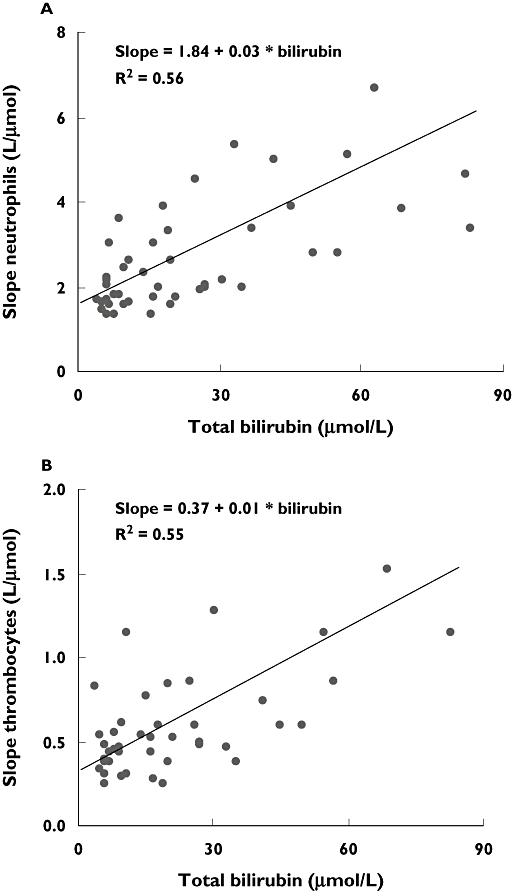
Linear regression of neutrophil (A), thrombocyte (B) slopes and bilirubin,with higher slopes indicating higher susceptibility to haematological toxicity
Official websites use .gov
A
.gov website belongs to an official
government organization in the United States.
Secure .gov websites use HTTPS
A lock (
) or https:// means you've safely
connected to the .gov website. Share sensitive
information only on official, secure websites.
Linear regression of neutrophil (A), thrombocyte (B) slopes and bilirubin,with higher slopes indicating higher susceptibility to haematological toxicity