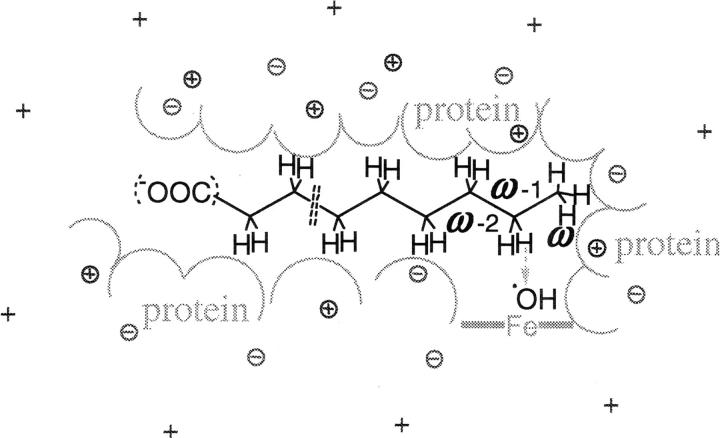
Figure 4.
Schematic drawing of the setup for the SE-QM substrate activation energy barrier calculations and those parts of the “environment” of the substrate that were included in the calculations: substrate (alkane chain in black), hydroxyl radical (•OH), charged residues in protein (positive and negative circled crosses), counterions (cross: +) and schematically the inner surface of the binding cavity in gray. The arrow indicates the reaction path calculated for the H-abstraction from the substrate. The active site cavity and heme-iron complex (—Fe—), although not explicitly included in the qm calculations, are schematically depicted in gray.

