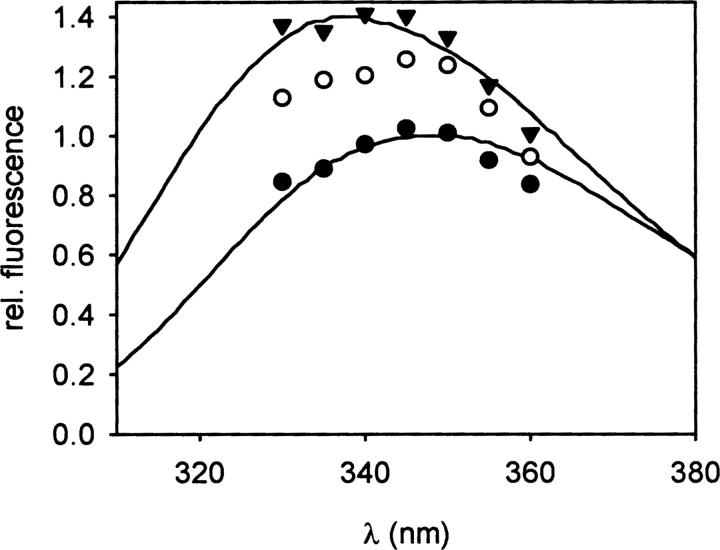
Figure 5.
Fluorescence spectra of proNGF. The specific fluorescence of the native (▾), intermediate (○), and denatured state (•) of proNGF was calculated from biphasic denaturation kinetics, measured at different wavelengths. For comparison, spectra of native (upper spectrum) and denatured (2 M GdmCl, lower spectrum) proNGF are shown (Kliemannel et al. 2004).

