
Figure 5.
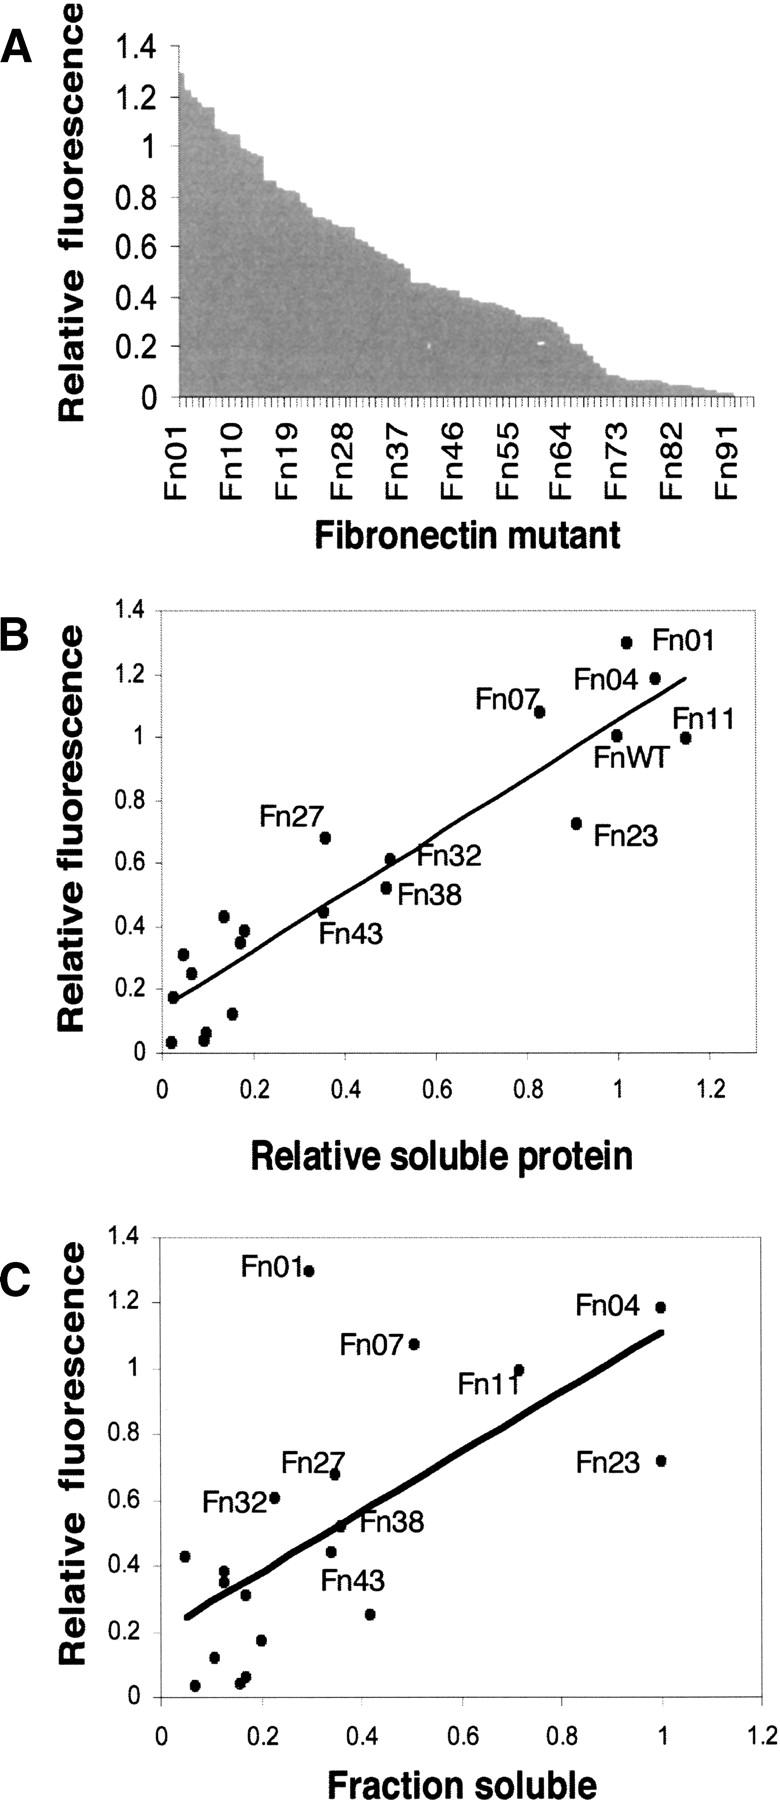
Expression analysis of 10FnIII library. (A) Expression fitness landscape of the 10FnIII library. Fluorescence intensity values of 94 Fn variant–GFP fusions were obtained from cell suspensions and normalized to WT 10FnIII(Δ1–7)-GFP. Each variant is marked by a dash on the X axis. (B) Relation between relative fluorescence and Fn variant soluble expression. Nineteen variants plus WT 10FnIII(Δ1–7) were subcloned into an expression vector without GFP. The relative expression values represent the amount of protein expressed in the soluble fraction relative to wild type measured by band densitometry. (C) The relation between relative fluorescence and Fn variant solubility, determined by band densitometry of soluble and insoluble fractions.