
Figure 4.
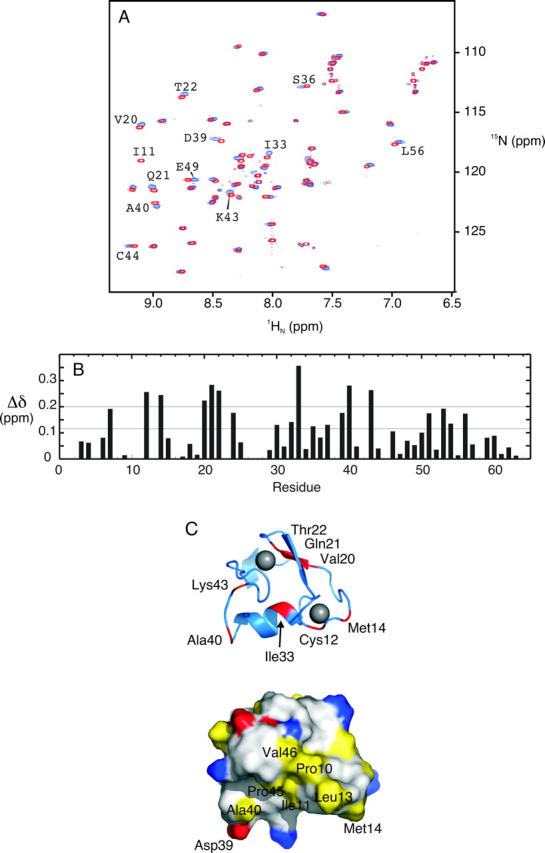
TRAF6-RD backbone amide chemical shift changes during titration with hUbc13. (A) Superposition of TRAF6-RD 1HN–15N HSQC spectra collected for TRAF6 alone (red) and ∼1:4 TRAF6:hUbc13 (blue), with various resonances labeled according to residue number. (B) Per-residue plot of chemical shift perturbation. The mean (0.11 ppm) and cutoff for one standard deviation from the mean (0.20 ppm) are included. (C) Cartoon (top) and surface (bottom) representation of the core residues (9–57) from the RING domain from TRAF6. For the cartoon representation, residues that experience chemical shift perturbation greater than one standard deviation from the mean upon titration with hUbc13 are red. Zn2+ ions are gray spheres. The surface representation is colored according to the scheme outlined in the legend to Figure 2.