
Figure 6.
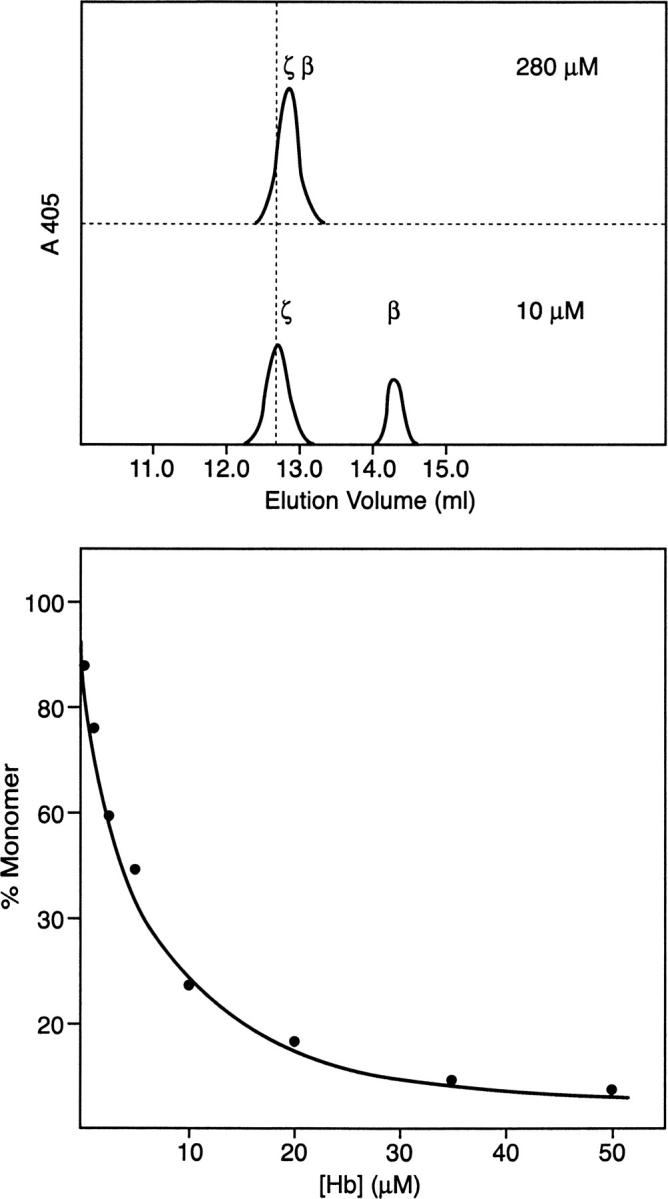
Dissociation of Hb Portland-2 dimers to monomers (top and middle panels) and profile of dissociation as a function of concentration (bottom panel). The concentrations shown on the top and middle panels are those applied to the Mono S column. There is a 10- to 15-fold dilution of the sample on the column. No peaks other than those shown here were observed.