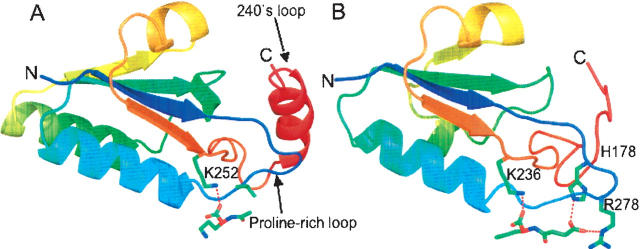
Figure 3.
A ribbon diagram of the knotted region of X. campestris AOTCase (A) (residues 170–275) and B. fragilis SOTCase (B) (residues 166–255) with bound ligands shown in colored sticks. Colors change continuously from blue (first residue in the region) to red (last residue in the region). The proline-rich loop (from dark blue to light blue), in similar conformation for both AOTCase and SOTCase, appears to be critical for the knot formation. The 240's loop (from brown to red) was threaded through the proline-rich loop to form a trefoil knot.

