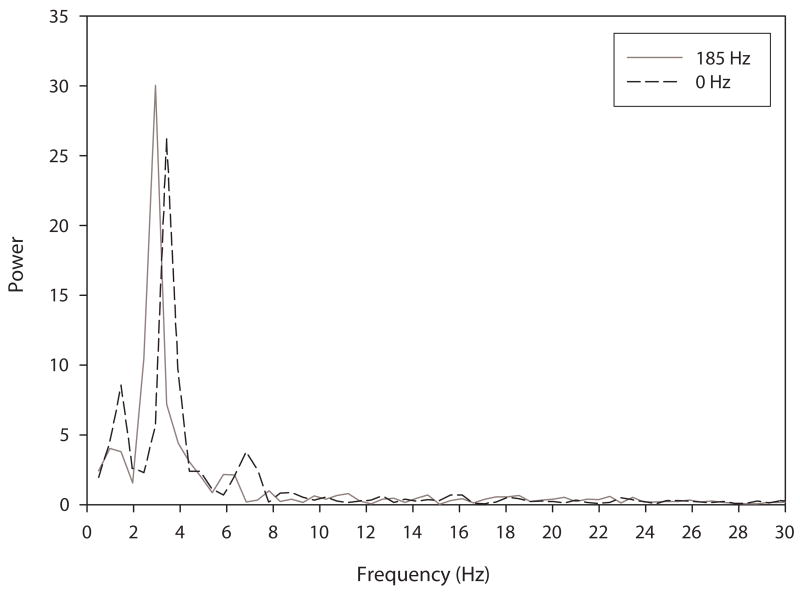
Figure 3.
FFT plots for the 0 Hz and 185 Hz postural tremor trials shown in Fig. 2. There is no substantial change in peak spectral frequency, which is in the range of 3–4 Hz for both trials, despite the substantial reduction in tremor amplitude at 185 Hz.

