
Figure 1.
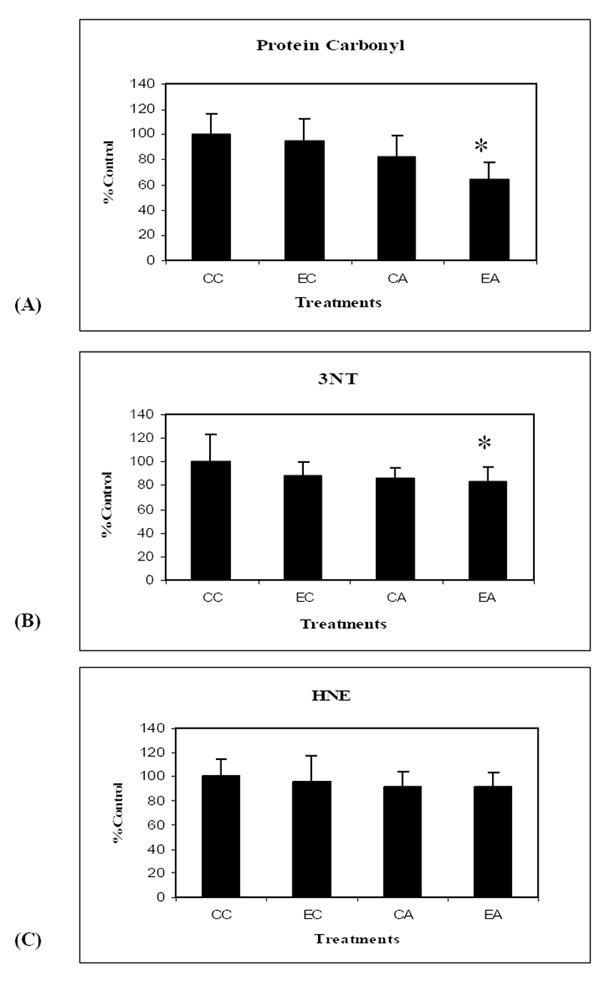
Changes in protein carbonyls (A), 3NT (B) and HNE (C) levels in canine brain homogenate samples following treatment. There was a decrease in the levels of protein carbonyls, 3NT and HNE measured from the various treatments, i.e. EC, CA and EA compared to the control group CC. Data are represented as % control ± SEM for animals in each treatment group. Measured values are normalized to the CC values (n=6) * p < 0.05 for canines on EA treatment.