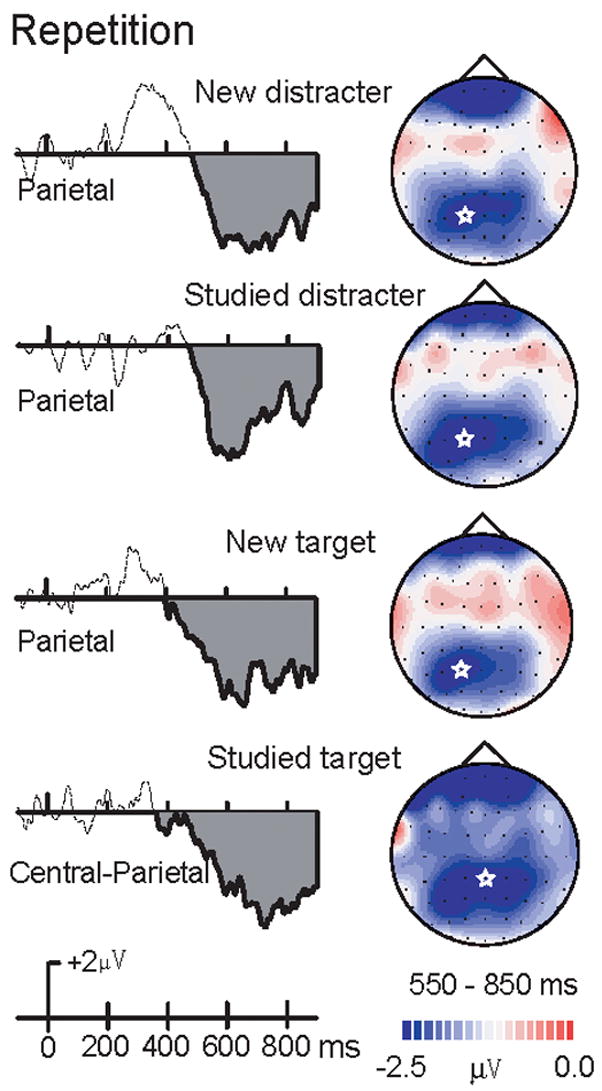
Figure 7. Difference waves for the late repetition effect.

Late repetition effects (repeated minus initial presentations) of new and studied targets and distracters. A star in each topographic map indicates the posterior maximum of this repetition effect. Repetition effects of new versus studied distracter activation (Top graph) and new versus studied target activation (Bottom graph).
