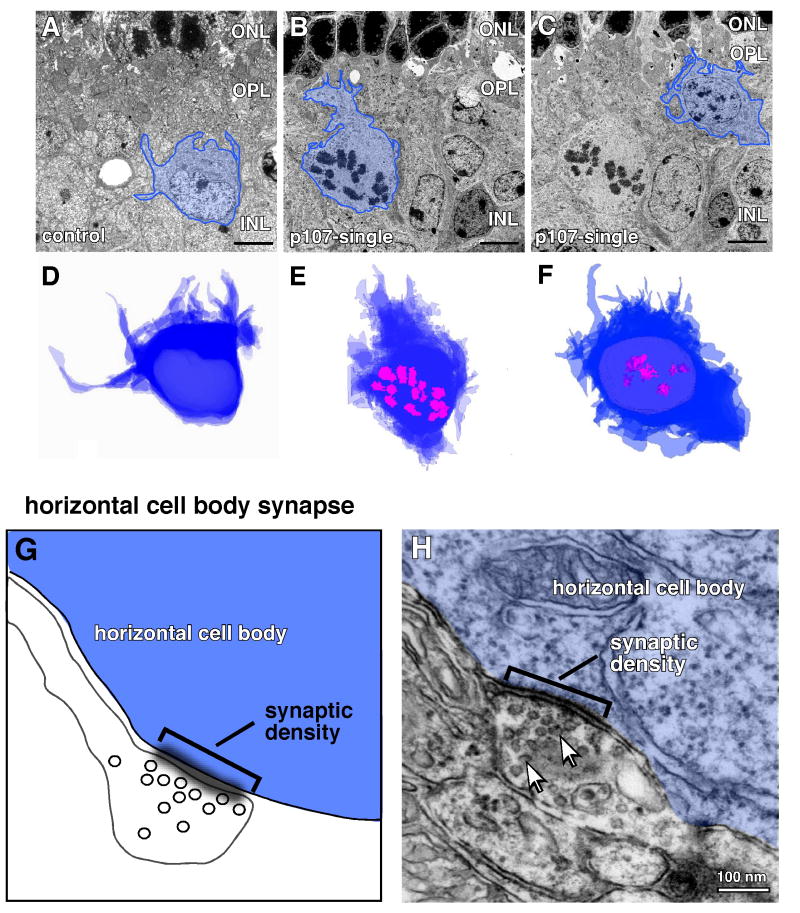
Figure 3. Proliferating horizontal cells are differentiated.
(A-C) Representative images of the 50 nm serial sections for each horizontal cell imaged using transmission electron microscopy (TEM). Horizontal cell bodies are outlined in blue. A normal horizontal cell in a control littermate is shown in (A) and two dividing horizontal cells in M-phase are shown in (B,C) as indicated by the presence of condensed chromosomes (mitotic figures). The cell bodies were traced from images of 130-150 serial sections per horizontal cell and stacked to form a 3-d representation of the cells shown in (A-C) (D-F). The condensed chromosomes in B,C are outlined in pink in E,F. (G) Diagram of one type of conventional horizontal cell synaptic connection present on the cell body with input from a small diameter process from a neighboring horizontal cell. (H) TEM image of a typical horizontal cell body synapse on the surface of a dividing horizontal cell in the p107-single retina. The synaptic density (sd) is indicated by the bracket and the synaptic vesicles are shown by arrows. Abbreviations: ONL, outer nuclear layer; OPL, outer plexiform layer.

