Figure 2.
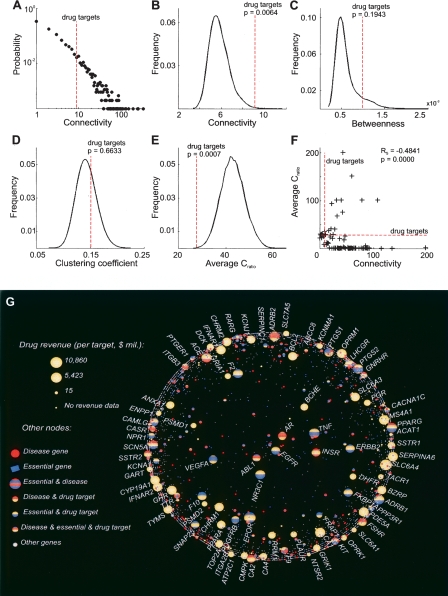
Molecular network and population-variability properties of targets of FDA-approved drugs. (A) Connectivity distribution for the entire molecular network. (B) Targets of the successful drugs are significantly more connected than an average gene in the network, but are not the most highly connected genes in the network. (C) Drug targets tend to have higher than average betweenness values. (D) The successful drug targets are not statistically different from the rest of the genes in terms of their clustering coefficients. (E,F) Analysis of the ratio (Cratio) of the number of nonsynonymous to synonymous single-nucleotide polymorphisms (SNPs). (E) Successful drug targets have significantly smaller Cratio than human genes on average. (F) The value of Cratio tends to correlate negatively with the gene’s connectivity in the network. (G) Connectivities of genes are superimposed with drug revenue data: the high-revenue drugs tend to target genes and proteins of low connectivity. The position of a gene is determined by its network connectivity. The closer a gene is to the center, the higher its connectivity within the GeneWays molecular network. The size of a gene node is determined by the revenue of the corresponding drug. The color of a gene node is determined by its membership in the three sets of genes: (yellow) drug targets, (blue) essential genes, and (red) disease genes. These three sets of genes overlap significantly.

