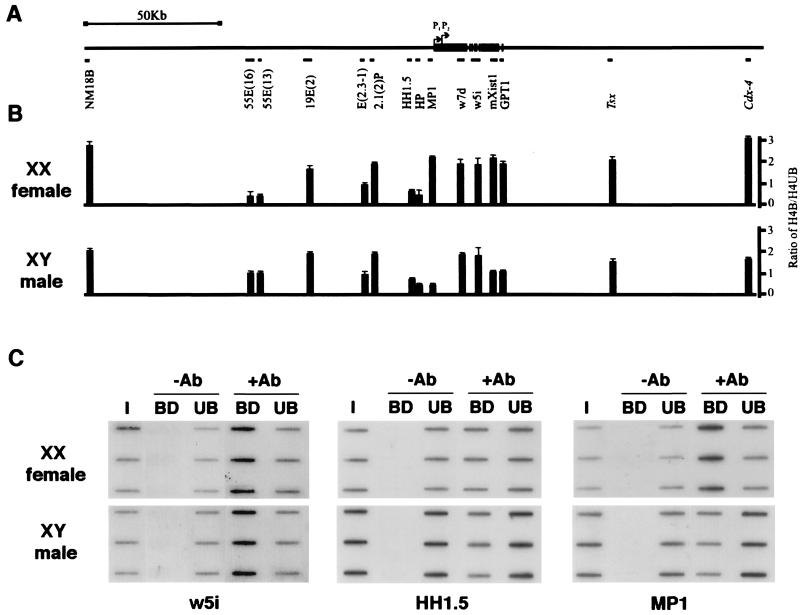
Figure 4.
Chromatin acetylation profile of the Xist locus. (A) Diagram illustrating the location of single-copy probes relative to the Xist gene. (B) Ratio of H4-bound/H4-unbound chromatin in XY male and XX female cells. Each value represents the mean of at least two independent experiments. (C) Examples of immunoprecipitations of XX female and XY male chromatin probed with w5i, MP1, and HH1.5 showing triplicate loadings of input DNA (I), and antibody-bound (BD) and -unbound (UB) fractions either in the absence (−) or presence (+) of specific antibody (Ab).

