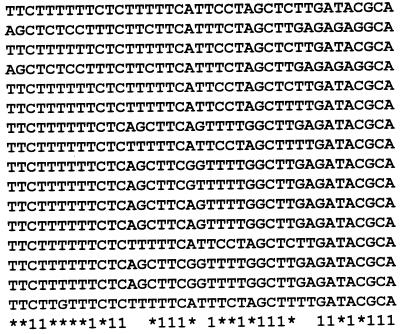
Figure 3.
Aligned DNA sequences corresponding to the amino acid sequences of group μ are displayed. 1 indicates a position strictly conserved among these sequences, and ★ indicates a position with average conservation index (CI, defined in Fig. 2 legend) exceeding 0.6. The scores for nucleotide comparisons are as follows: identity has value 1, a transition replacement (A ↔ G or C ↔ T) has value 0.3, a substitution A ↔ T or G ↔ C has value −0.3, and a substitution A ↔ C or G ↔ T has value −0.5. The average CI for these sequences over all columns is 0.8, and 87% of the columns show a CI value above 0.6 emphasizing a high level of conservation.

