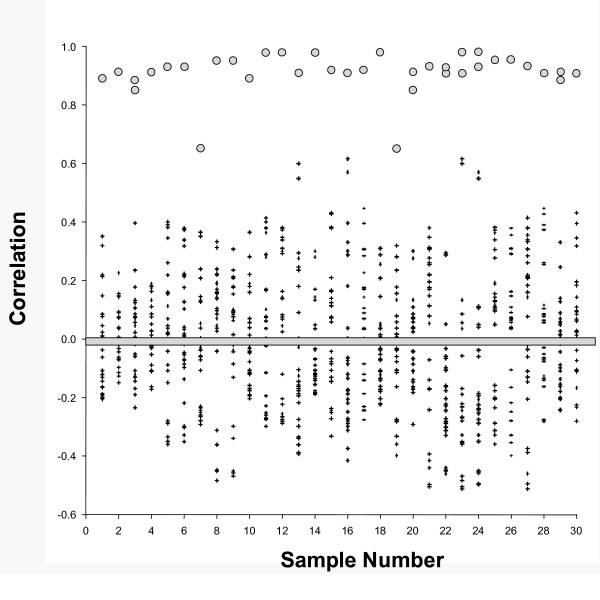
Figure 1.
Correlation analysis of human plasma based on 66 metabolites. Pearson correlations of each of 30 samples with each of the other 29 samples are presented graphically. Each datapoint represents the mean correlation for the 66 metabolites between the specific sample and each of the other 29 samples. Filled circles show the correlation of a sample with its correct duplicate or triplicate. Small pluses show the correlation of a sample with unmatched samples. A heavy bar has been placed at zero for visual reference.

