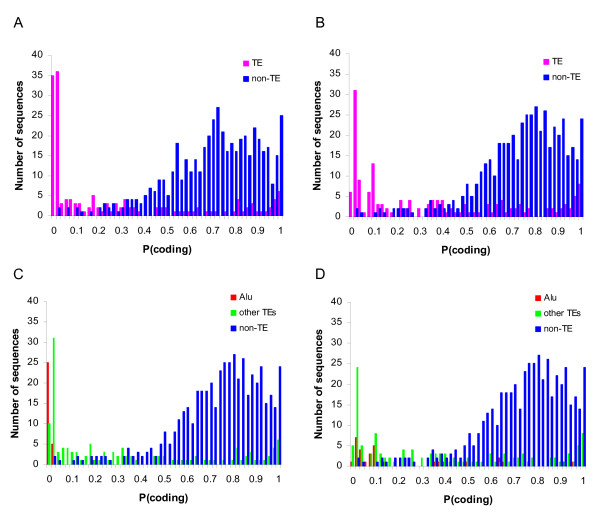
Figure 4.
Coding probability of human CCDS genes. The coding probability of TE-derived coding sequences (pink) and non TE-derived coding sequences (blue) are shown, with results from the original GeneMark model (A) and our custom trained GeneMark model (B). TEs are separated in Alu (red) and non-Alu (green) for the original (C) and custom (D) GeneMark models.

