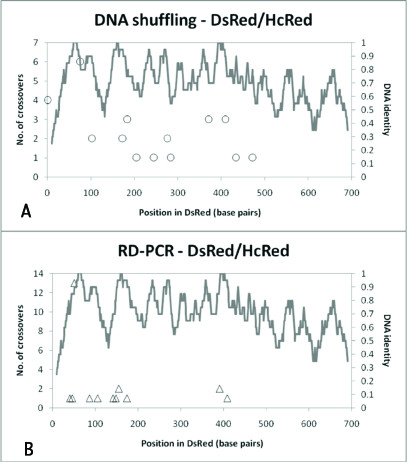
Figure 6.

Frequency and location of crossovers obtained from recombination of HcRed and DsRed. (a): The frequency and location of crossovers in DNA shuffled libraries obtained from HcRed and DsRed. The lines indicate rolling DNA identity calculated by summing the number of identical DNA bp in a 20 bp window and dividing by 20 bp. So, one would indicate that 100% DNA identity in a 20 bp window, ten to the left and ten to the right of a DNA residue. (b): The frequency and location of crossovers in RD-PCR libraries obtained from HcRed and DsRed.
