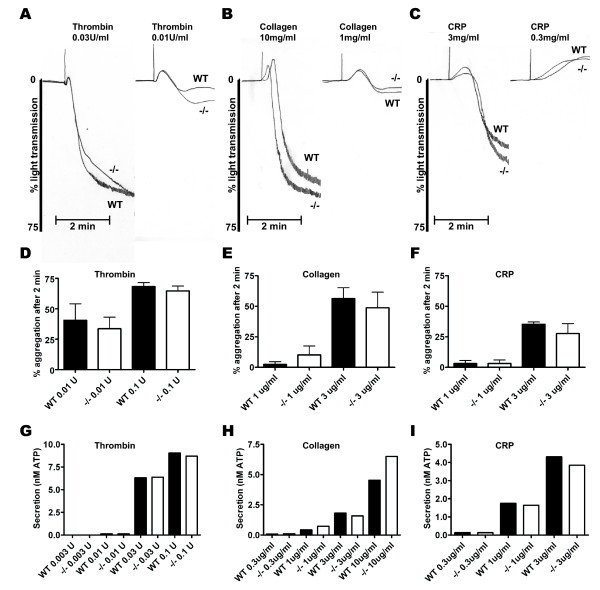
Figure 4.
Aggregation and secretion response of WT and HS1-/- platelets. (A) – (C) Representative aggregation traces for WT and HS1-/- platelets in response to maximal and threshold concentrations of thrombin, collagen and CRP. (D – I) Percentage aggregation and ATP secretion of WT and HS1-/- platelets was determined after 2 min stimulation with varying concentrations of thrombin (D & G), collagen (E & H) and CRP (F & I). For % aggregation the mean ± SEM of 3 different mice is presented. For ATP secretion, mean ± SEM from 1 representative experiment is shown (WT – Black bars, HS1-/- – White bars). No significant difference was observed between WT and HS1-/- platelets for any of the agonists tested.

