
Figure 2.
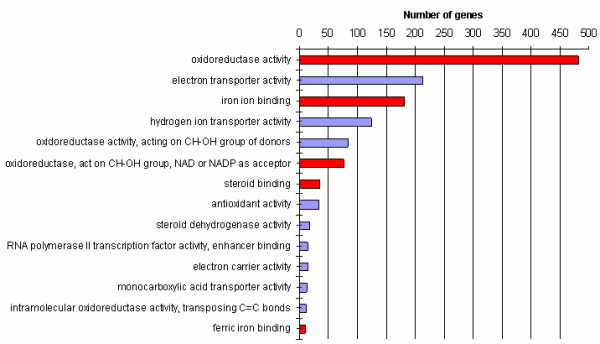
Gene ontology (GO) results for the molecular function ontology. The genes differentially expressed at p < 0.01 were analysed for over-represented GO terms in the molecular function ontology. Some terms were common for Duroc and Norwegian Landrace (red) while some were only significant in Norwegian Landrace (blue). Number of genes is the number of genes that was found significantly differentially expressed (p < 0.01) for a term.