
Figure 1.
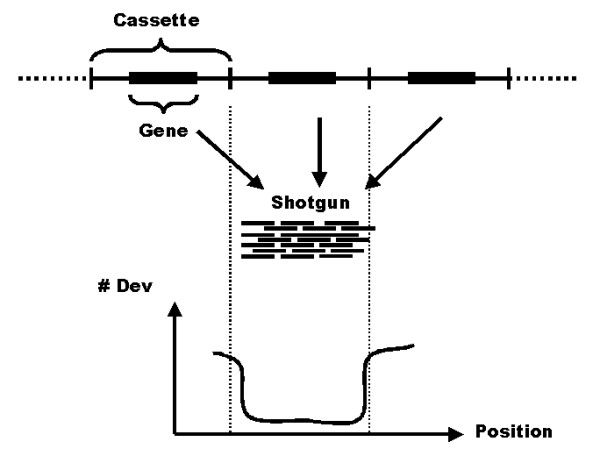
Cassette estimation. Schematic description of the procedure for cassette estimation. The top of the figure shows the layout of a repeated region. The repeat unit can consist of a gene, as well as flanking, non-coding sequence, and the repeat array is flanked by unique sequence (indicated by dashed lines). The middle of the figure shows how, typically, the shotgun reads will form a single alignment that represents a merge of all repeat copies. The graph at the bottom of the figure shows the number of deviating bases (y-axis) along the alignment (x-axis). The number of bases deviating from consensus will typically be low within the alignment, and increase towards the ends due to the presence of shotgun reads partially sampling unique sequence.