
Figure 1.
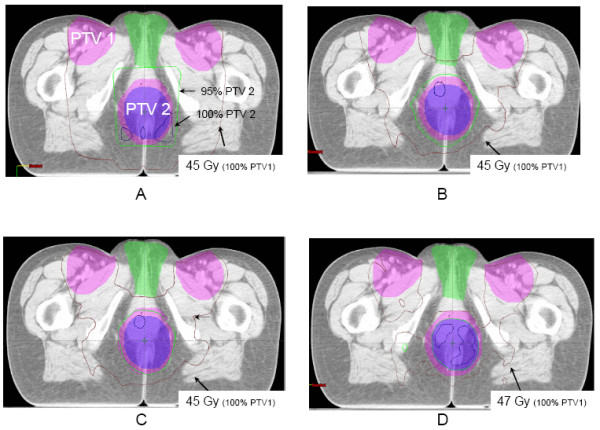
Dose distributions by treatment arm on the same axial CT slice through both target volumes (PTV1 and PTV2) and the external genitalia in a female patient. This CT slice shows the sparing of the genitalia by the 45 Gy isodose curve in arms B, C, and D as compared with arm A.