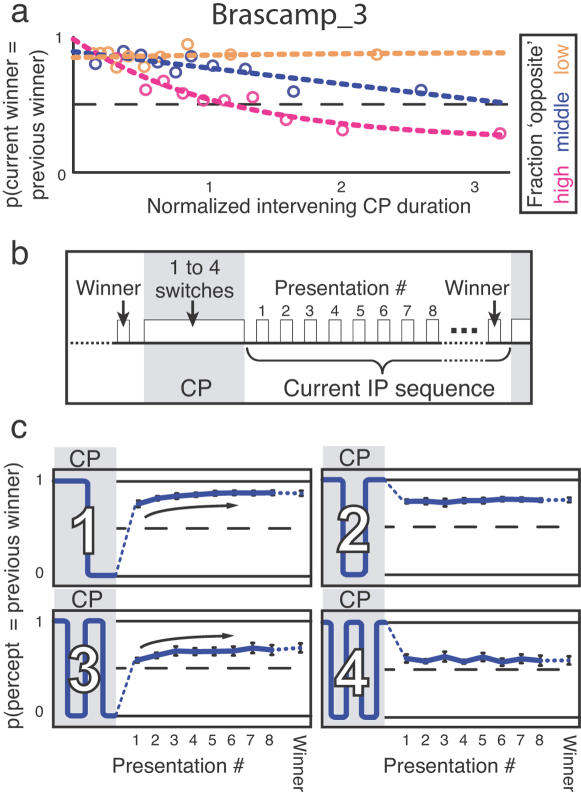
Figure 3. The influence of dominance throughout a continuous presentation episode on stabilization.
a, The data of the second experiment were regrouped according to the fraction of opposite dominance; that is, the fraction of the time during a continuous viewing period that subjects experienced the percept opposite to the previous winner. The relation between the probability for the previous winner to also win the current intermittent presentation sequence (y-axis) and the intervening continuous presentation duration (x-axis) is affected by this fraction. The probability decays faster during continuous viewing periods containing mainly opposite dominance (magenta) than during periods containing more dominance of the previous winner itself (blue and orange). For this panel the durations of continuous presentation periods were normalized per subject by dividing by their mean continuous presentation duration (17 s on average), and then pooled over subjects. Data were split into three quantiles of the fraction of opposite dominance. Normalized continuous presentation durations for each of the three groups were then divided into ten quantiles to yield ten data points. The magenta and blue data points show a negative trend (p<0.01, Spearman; ρ = −0.98 and –0.68, respectively), but the orange ones do not (p>.25; ρ = −0.07). Note that, overall, the opposite percept took up more time during continuous viewing than did the previous winner percept (average fraction of opposite dominance is 0.61). b, The data of the second experiment were reanalyzed to study perception during the first eight presentations of an intermittent presentation sequence, as well as during the winning presentation. c, Probability that the previous winner dominates on individual presentations of the current intermittent presentation sequence, for up to four intervening perceptual switches (digits and diagrams on the left). In those conditions where continuous viewing ended in the percept opposite to the previous winner (after one or three switches), the probability of perceiving the previous winner is lower during the initial intermittent presentations following continuous viewing than during later presentations (trend marked by arrows; Spearman p<0.01; ρ = 0.88 for both one and three switches). Error bars indicate standard errors (n = 7).

