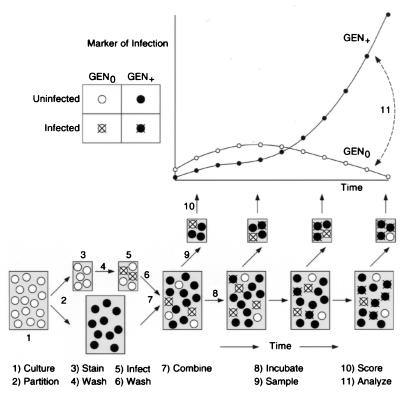
Figure 1.
Time-series experiment for determining HIV age-specific fertility. The figure shows two groups of cells, Gen0 (fluorescent) and Gen+ (nonfluorescent), along with the various steps for preparing and using these cells. The figure also shows stylized plots of the time-series data from Gen0 (○) and Gen+ cells (●), which are derived from hypothetical flow-cytometry measurements. In general, experiments are performed under conditions that limit the number of doubly infected cells, because such events fail to reflect in vivo conditions. Initially, such conditions require a relatively low multiplicity of infection for Gen0 cells [multiplicity of infection (moi) < 0.1] and throughout the assay, a relatively low moi for the combined Gen0 and Gen+ cells (moi < 0.5). The step-by-step procedures are as follows. (i) Before assays, cell cultures are grown under conditions that ensure constant susceptibility to infection. (ii) Cell cultures are partitioned into two unequal portions, one for preparing cells for generation zero (Gen0) and the other for preparing cells for generations one, two, three, etc. (designated collectively as Gen+). (iii) Gen0 cells are labeled with fluorescent dye and (iv) washed to remove excess dye from the surrounding medium. For such steps, several dyes are available that form stable associations with cytoskeletal proteins but, at low concentrations, do not appear to interfere with cell growth and metabolism (21). (v) Labeled Gen0 cells are infected with cell-free HIV for a period of 1–2 hours and (vi) washed again to remove excess virions from the surrounding medium. After the second wash, cell-free virions must be absent, because their presence can corrupt numerical determinations of age-specific fertility. (vii) Labeled and infected Gen0 cells are then combined with unlabeled and uninfected Gen+ cells. In order to ensure that the growing infection propagates into Gen+ cells and not Gen0 cells, the ratio between Gen0 and Gen+ cells should be relatively large (e.g., >1:30). Such a large ratio also helps to keep the moi low throughout the assay. (viii) Cells are incubated under constant culture conditions (5% CO2 and 37°C) with gentle mixing to prevent clumping. (ix) Over a period of several days, cells mixtures are sampled periodically (for example, every 3–6 hours), washed, and fixed with preservative to halt viral reproduction. To reduce perturbations from sampling procedures, the total volume of cells removed should be a fraction (<50%) of the culture’s starting volume. (x) Multilaser flow cytometry is used to score for cell generation and markers of infection. Cells are stained with fluorescent mAbs against viral markers appearing very early within the cytoplasm (anti-p10, anti-p32, etc.) or somewhat later on the cell surface (anti-p24, anti-p41, etc.). Gen0 and Gen+ cells are distinguished by the presence or absence of fluorescent cytoskeletal labels, respectively. Cellular markers of infection can be scored by threshold and continuous counting procedures: as infected (+) and noninfected (−) according to cutoff immunofluoresence values; or as infected according to the actual amount of immunofluoresence detected. In principle, both counting procedures should yield comparable data and offer cross-checks of experimental consistency. At the start of the experiment, Gen0 and Gen+ cells will express relatively few markers of viral infection. Such sparse data will therefore demand the counting of more cells to collect reliable statistics and reduce experimental noise. (xi) Analysis of the data is carried out by mathematical procedures as described in Methods. The appearance of the marker in Gen0 cells together with the age-specific fertility curve determines the appearance of the marker in Gen+ cells. Thus, age-specific fertility can be viewed as a mapping between the marker on Gen0 cells and Gen+ cells (dashed line).

