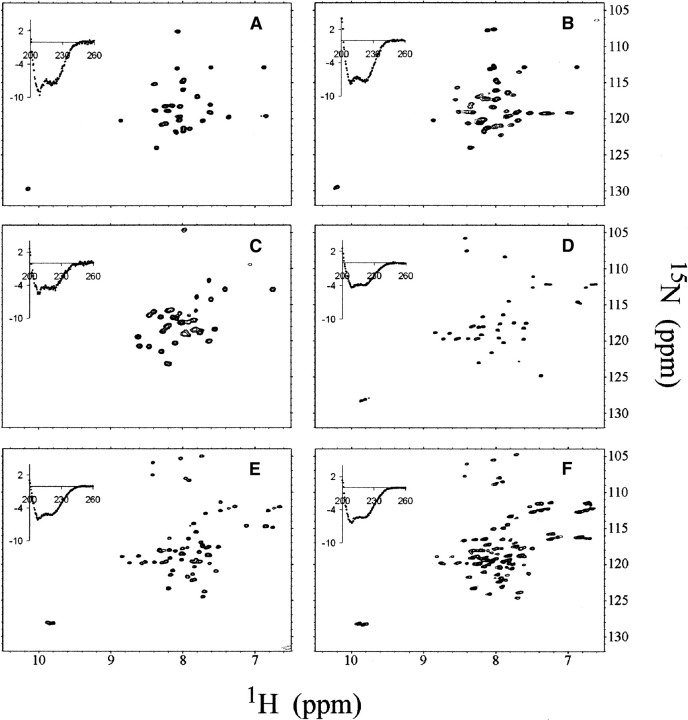
Figure 3.
CD (inserted figures) and 1H-15N HSQC spectra of TMPs. CD and NMR spectra were recorded under similar conditions (see Materials and Methods). The units in CD spectra are wavelength (nm) and molar circular dichroism, Δɛ (M−1· cm−1) for abscissa and ordinate, respectively. (A,B) M2 (22–46) and M2 (22–62) in 5% LPPG, respectively. (C) KdpF in 5% SDS. (D,E,F) CorA–TM2, CorA–2TM, and CorA–2TM+ in 5% SDS, respectively. The samples for NMR were in 10 mM DTT, 100 mM acetic acid buffer, pH 4.5, and the spectra were recorded at 50°C on a Varian Inova 500-MHz, 600-MHz, or 720-MHz spectrometer.

