
Figure 4.
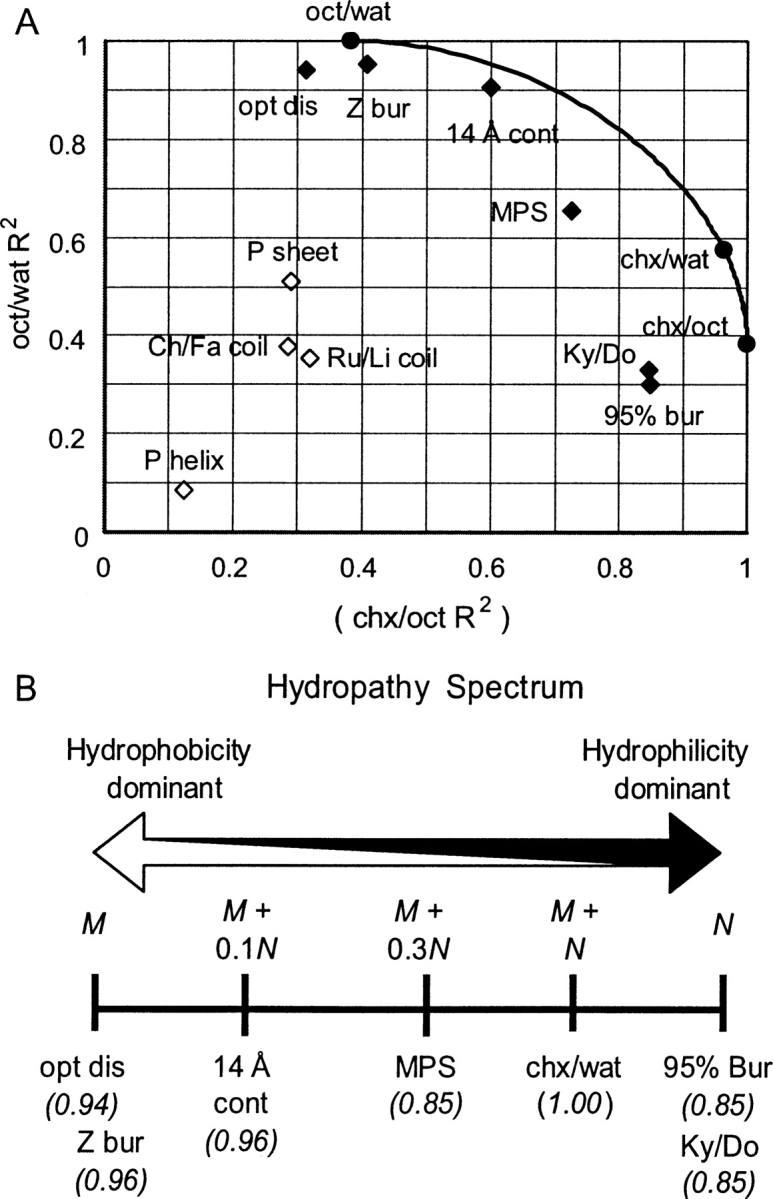
Hydropathy spectrum. (See abbreviation footnote and body of text for explanation of abbreviations.) (A) The relative degree of hydrophobic and hydrophilic components of various scales are approximated by calculating R2 values (calculated excluding C, P, H, R, K, D, E) against octanol/water (oct/wat) partitioning energies (Guy 1985; Radzicka and Wolfenden 1988) on the Y-axis and cyclohexane/octanol (chx/oct) partitioning energies (Radzicka and Wolfenden 1988) on the X-axis, respectively. The curved line represents correlations for perfect, positive linear combinations of the oct/wat and chx/oct scales. Values for scales that can be largely explained by hydropathy fall near the curve and are represented by black diamonds. Values for the remaining scales are represented by open diamonds. (B) Locations of different scales along the hydropathy spectrum are represented by a linear combination of the oct/wat scale (M) and the chx/oct scale (N) that produces a near-maximum correlation with the scale, thus estimating the relative degrees to which the hydrophilic and hydrophobic components are present, respectively (the general magnitude of N is greater than that of M). Below the name of each scale, in italics, is the strength of association (R2) of that scale with the respective linear combination of M and N noted above it.