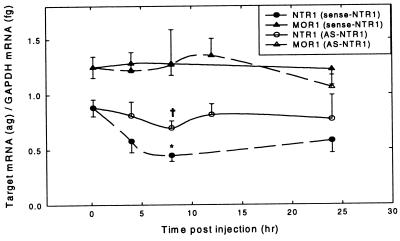
Figure 6.
Effect of antisense PNA to the NTR1 (AS-NTR1) and sense-NTR1 PNA targeted to the NTR1 microinjected directly into brain on mRNA levels of NTR1 and MOR1 over time. Rats were microinjected with either AS-NTR1 PNA (5 μg; open symbols) or sense-NTR1 PNA (5 μg; filled symbols) into the PAG for various times but the PAG harvest time of day was identical for all animals (to avoid possible diurnal variations in mRNA levels). The 0 time represents animals receiving no PNA. Levels of NTR1 (circles) and MOR1 (triangles) mRNA were determined by gene specific reverse transcriptase–PCR and are presented as a ratio normalized to the levels of mRNA for GAPDH. ∗, P < 0.05 vs. control; †, P < 0.05 anti-NTR1 (NTR1) 8-hr time point vs. sense-NTR1 (NTR1) 8-hr time point.

