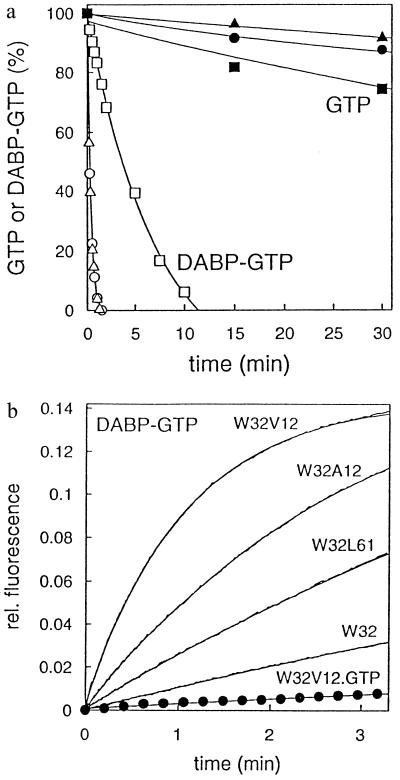
Figure 3.
HPLC and fluorescence measurements of the hydrolysis reaction of GTP and DABP-GTP by oncogenic Ras. (a) GTPase (full symbols) and DABP-GTPase (open symbols) of V12Ras (triangles), R12Ras (circles), and A13Ras (squares) were analyzed by HPLC as before. (b) Time course of tryptophane fluorescence of the DABP-GTPase reaction of oncogenic Ras mutants (as indicated) in W32-background was measured as before. As an internal control, the GTPase of W32V12Ras is shown. The data were analyzed by single exponentials.

