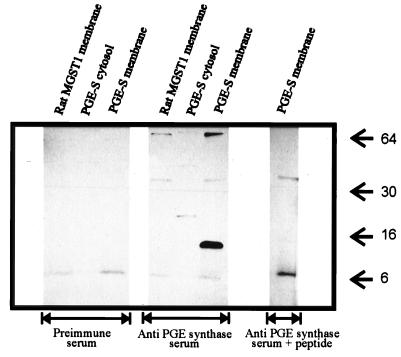
Figure 2.
Western blot analysis of PGE synthase expression. Both the membrane and cytosolic fractions from bacteria expressing PGE synthase were analyzed by SDS/PAGE and Western blotting. As control, the membrane fraction from bacteria expressing ratMGST1 was included. In all lanes, 5 μg of total protein were analyzed. The middle blot demonstrates the results obtained by using antipeptide antiserum against PGE synthase whereas the left blot shows the results using the corresponding preimmune serum. For the right blot, the antipeptide antiserum was diluted in the presence of 10−6 M peptide antigen. Arrows denote the migration of protein size markers. The exposure time was 2 min.

