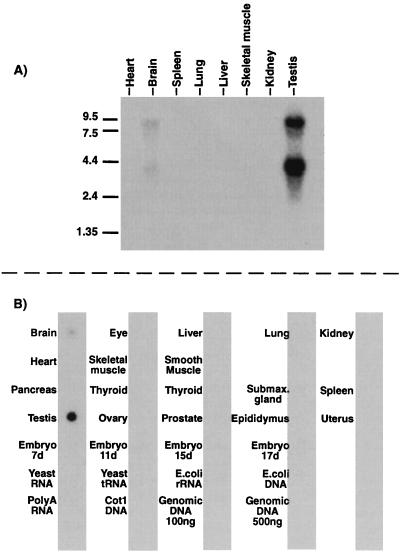
Figure 2.
Northern blot and RNA dot blot analyses of PDE10A expression. (A) Northern blot analysis of poly(A) RNA from mouse tissues. Two bands, 9 kb and 4 kb, are detected in both testis and brain that hybridize to PDE10A probes. (B) RNA dot blot analysis of 22 mouse tissues. Consistent with Northern data, mouse testis and brain appear to express PDE10A, with highest levels of expression in testis.

