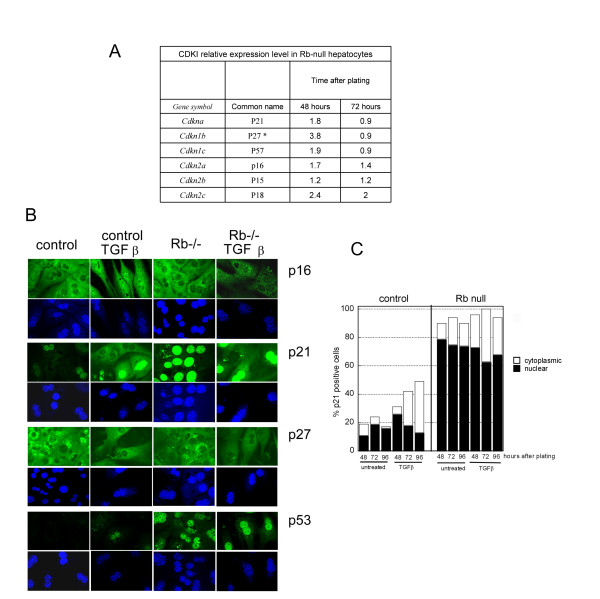
Figure 3.
Effect of TGFβ on P53, P16INK4A, P21Cip1 and P27KIP1 expression A: Expression of CDKI in Rb-null hepatocytes. The table gives the level of expression of the various CDKI in Rb-null hepatocytes relative to control hepatocytes. The values were obtained using a gene expression array as described in methods. * The level of p27KIP1 expression in control cells was low, and the ratio may therefore be overestimated. B & C. Hepatocytes were treated or not with TGFβ 24 hours after plating. B. Immunofluorescence for P16INK4A, P21Cip1, P27KIP1 and P53. Photos were taken 48 hours after treatment. Green: specific immunofluorescence, blue: Topro-3 nuclear counterstain. C: Quantification of P21Cip1 immunopositivity. Black bars: percentage of cells exhibiting nuclear staining. White bars, cytoplasmic staining.

