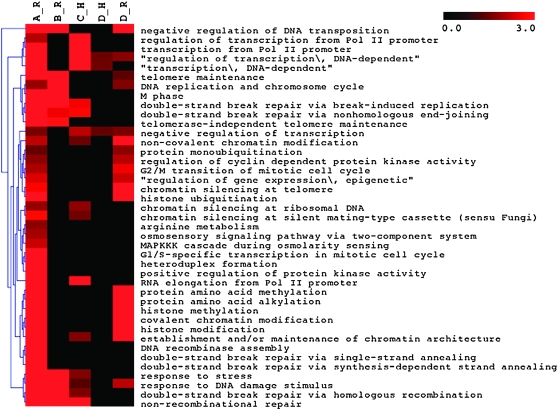
Figure 2.—
Heat map of enrichment scores of GO biological process terms (GOBPs) for gene lists derived from independent screens for Ty1 (Scholes et al. 2001; Griffith et al. 2003) and Ty3 modulators (Irwin et al. 2005). The gradient of red color indicates the enrichment levels with black representing no enrichment [maximum enrichment ≥3 (P-value ≤0.001), no enrichment = 0 (P-value >0.05)]. Rows of the heat map are GOBPs and columns are the genetic screens for Ty modulators. A-R: more detailed GOBPs associated with Ty1 restriction genes identified in this work (supplemental Table S1). A heat map containing all GOBPs associated with Ty1 restriction genes identified here is shown in supplemental Figure S1. B-R: GOBPs associated with Ty1 restriction genes identified by transposon mutagenesis (Scholes et al. 2001). C-H: GOBPs associated with Ty1 helper genes identified by systematic screening of a diploid deletion library (Griffith et al. ;2003). D-R: GOBPs associated with Ty3 restriction genes identified by systematic screening of a haploid deletion library (Irwin et al. 2005). D-H: GOBPs associated with Ty3 helper genes identified by systematic screening of a haploid deletion library (Irwin et al. 2005). Hierarchical clustering of the GOBPs for Ty modulators is shown on the left.

