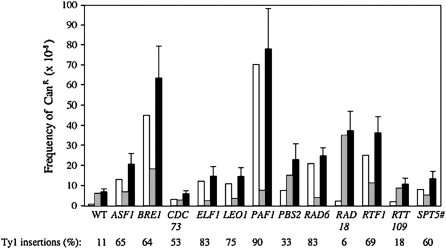
Figure 4.—
Frequency estimate of Ty1- and non-Ty1-induced CanR mutations. Open bars, frequency of CanR mutations caused by Ty1 insertion; cross-hatched bars, frequency of CanR mutations caused by other mutational events; solid bars, overall frequency of CanR mutations. Standard deviations are above the solid bars. On the bottom is the fraction of CanR mutations caused by Ty1. Also refer to supplemental Tables S4 and S5.

