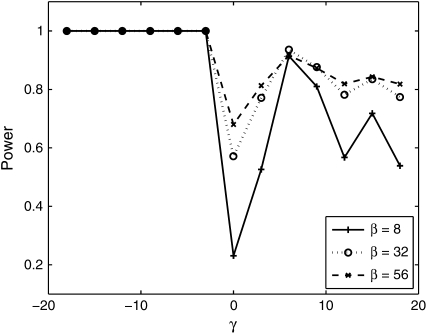
Figure 10.—
Power to distinguish positive and negative selection from fluctuating selection. Data were simulated for β ∈ {8, 32, 56}, n = 20, and θ = 60. The x-axis is the selection coefficient, the parameter of the data where the empirical distribution of the test statistic was obtained to get a critical value for the test.

