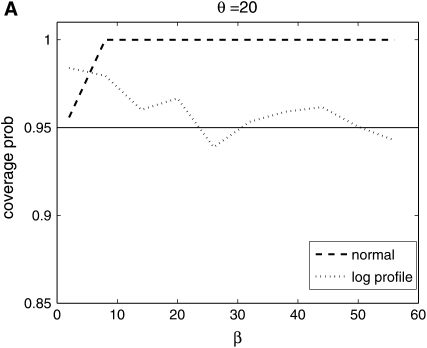
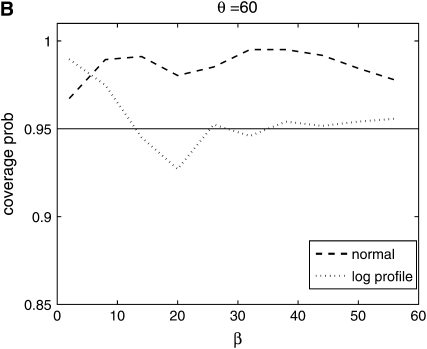
Figure 8.—
Coverage of 95% confidence intervals using two different methods for building confidence sets. One is based on the normal approximation and the other uses the difference in profile log likelihood. The coverage under the normal approximation is always higher than when using the profile log-likelihood function.


