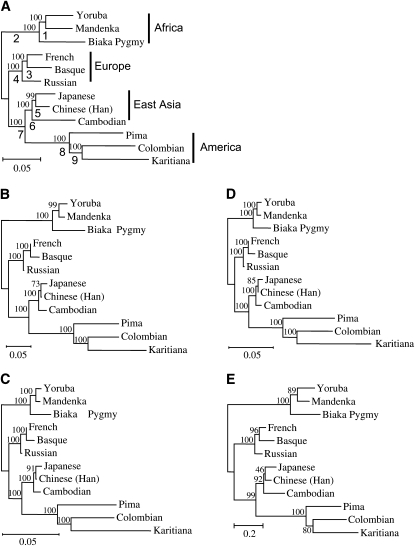
Figure 1.—
The phylogenetic trees of 12 representative populations. The phylogenetic trees were constructed with different distance measures using 783 STR loci. The phylogenetic trees with all the distance measures have the same topology. This tree topology is used as a model tree for testing the relative efficiencies of the different distance measures. (A) The DA tree. The numbers above and below the branches of the tree are bootstrap values and numbers assigned to the branches, respectively. (B) The DS tree. (C) The FST* tree. (D) The FST′ tree. (E) The (δμ)2 tree. (B–E) The numbers on the branches of the trees are bootstrap values. The countries where the populations are located are as follows: Yoruba, Nigeria; Mandenka, Senegal; Biaka Pygmy, Central African Republic; French, France; Basque, France; Russian, Russia; Japanese, Japan; Han, China; Cambodian, Cambodia; Pima, Mexico; Colombian, Columbia; and Karitiana, Brazil. There are two Han population samples in the data of Ramachandran et al. (2005) (see supplemental Tables 1–4 at http://www.genetics.org/supplemental/), Han from China and Han from northern China. Here we exclude the Han samples from northern China.

