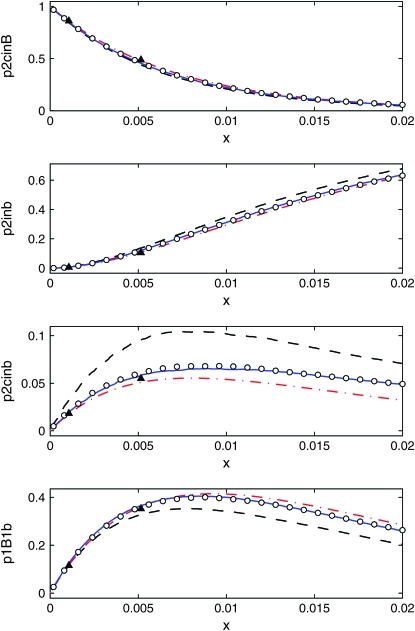
Figure 8.—
The distribution over the partitions as a function of the genetic distance x from the selected locus, from 10,000 samples. We show one section for each of the four partitions. The population size is N = 104, and the selection parameter s = 0.1. The data shown are Moran simulations (circles), the logistic model (dashed black line), our own model (solid blue line), the DS algorithm (dash-dotted red line), and coalescent simulations of Durrett and Schweinsberg (2004) (triangles).

