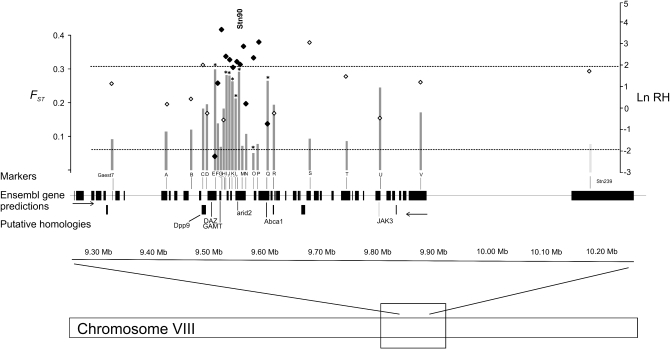
Figure 3.—
Schematic overview of the genomic region (∼800 kb) flanking the candidate locus Stn90. The shaded bars show the Bayesian FST estimates (locus effects) for the loci spanning in this interval. Asterisks denote significant P-values at the 5% level on the top of the shaded bars. The Ln RH estimates are indicated as solid and open squares. The solid squares indicate Ln RH values, which were included in the multilocus Ln RH test. The dashed lines indicate the expected neutral distribution (from −1.96 to 1.96) of the Ln RH values. The solid boxes indicate Ensembl gene predictions and their putative protein homologies.

