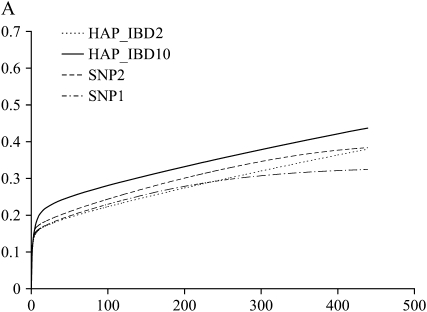
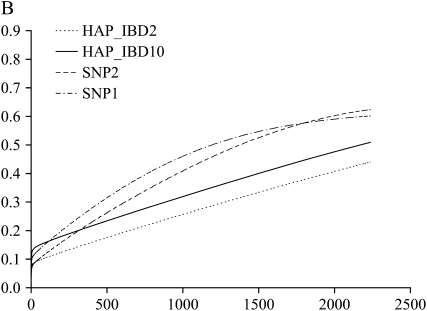
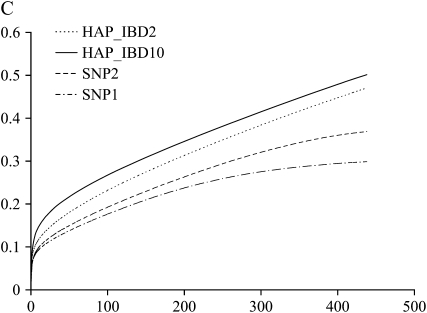
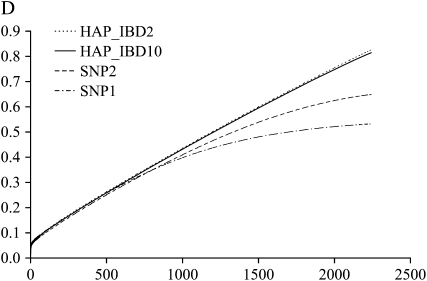
Figure 3.—
Cumulative estimated haplotype variances, expressed as proportion of total simulated QTL variance, across loci with decreasing estimated haplotype variance for the trait with h2 = 50% and the low (A) and high (B) SNP density and for the trait with h2 = 10% and the low (C) and high (D) SNP density.


