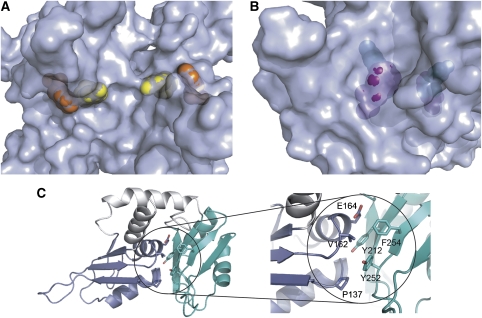
Figure 5.
RRM–interdomain contacts. (A, B). Surface representations of FIR1+2 contrasting the surface exposure of DNA-recognition residues of the N-terminal RRM domain (RRM 1) to the relative inaccessibility of corresponding residues of RRM 2. In panel A, Tyr115 (yellow) and Phe157 (orange) are both solvent exposed. In panel B, Tyr212 (green) is completely buried and inaccessible to solvent, and Phe254 (purple) is mostly buried. (C) Cartoon and stick representation of the hydrophobic interactions between the two domains. Aromatic residues in the putative nucleic acid-binding site of RRM2 are involved in interdomain hydrophobic contacts. The RRM1 domain is colored blue, and the RRM2 domain is colored cyan, as in Figure 2.

