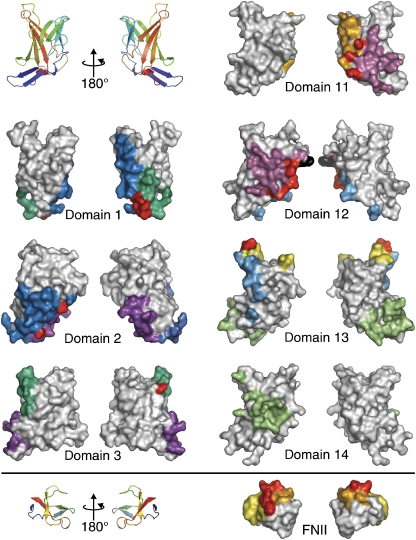
Figure 2.
Interface regions in IGF2R. ‘Front' and ‘back' surface views are shown of each IGF2R domain so far crystallized as part of a multi-domain fragment. Cartoon representations are included for orientation purposes. Coloured patches highlight regions involved in interfaces with other domains, with corresponding patches coloured the same. Residues involved in interfaces are defined as those undergoing a change in ASA. Red patches represent residues with ASA buried in more than one interface.

