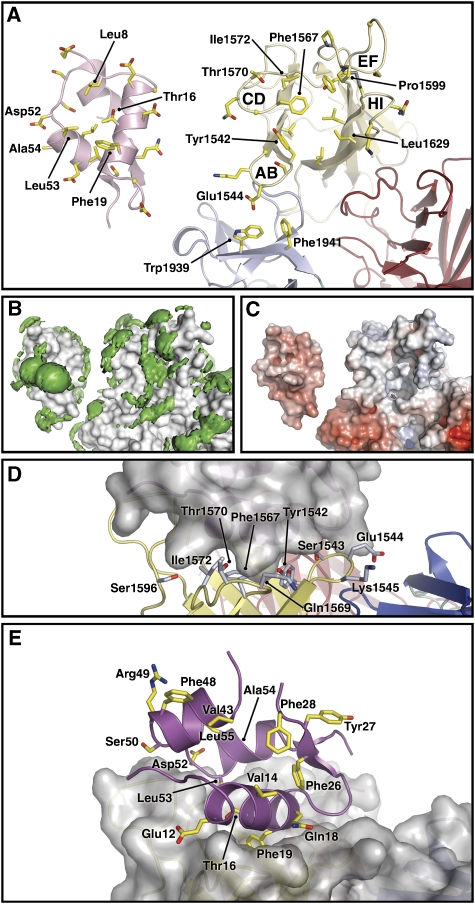
Figure 3.
Views of the IGF2R-Dom11–13/IGF-II complex and summaries of prior mutagenesis studies. (A) An open-book style view in cartoon representation. Side chains undergoing ASA change upon complexation are shown as sticks and key side chains are labelled. (B) Hydrophobic patches (green) on the surface, defined using the programme GRID (Goodford, 1985) and shown here as volumes of pseudo-energies contoured at −2.3 kcal/mole. (C) The electrostatic potential surface, produced using the APBS Tools plug-in for Pymol (Baker et al, 2001) and contoured ±10 kT (blue denotes positive and red negative potential). (D) IGF2R side chains in the proposed IGF-II-binding region, which have been mutagenized (Zaccheo et al, 2006). IGF2R is shown in cartoon representation and IGF-II as surface representation. (E) IGF-II side chains mutagenized before this study (note Ala54 is not visible). IGF-II is shown in cartoon representation and IGF2R as surface representation.

