
Figure 2.
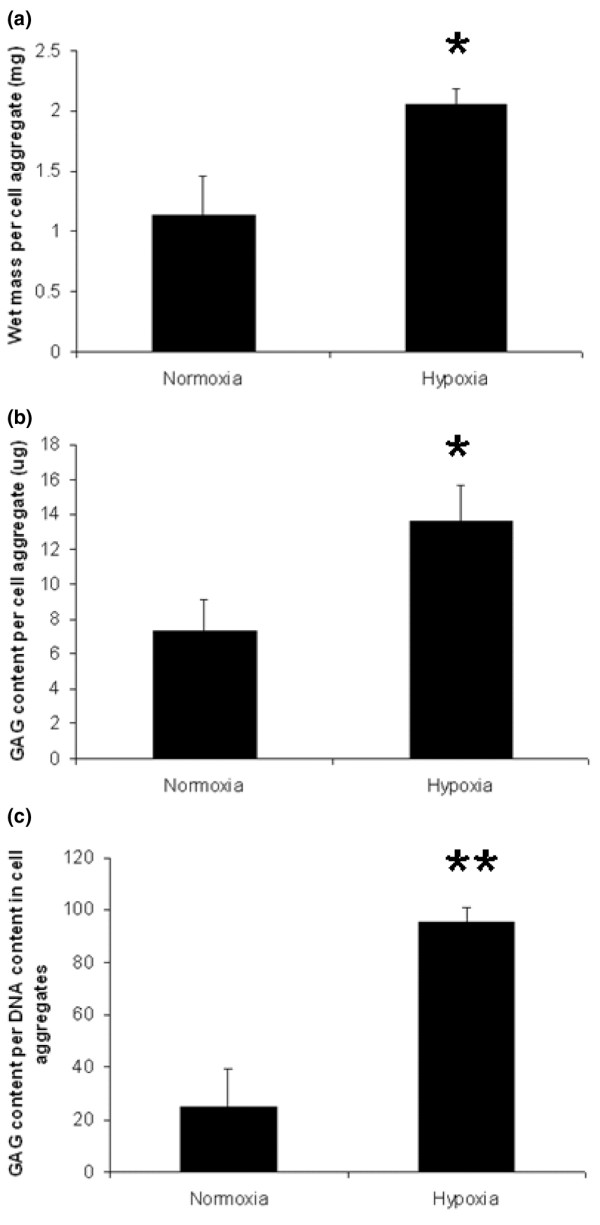
Chondrogenic cultures of infrapatellar fat pad cells and the effects of hypoxia. Wet weight (a), glycosoaminoglycan (GAG) analysis (b) and GAG per DNA measurement (c) of cell aggregates after chondrogenic differentiation for 14 days under normoxic and hypoxic conditions. Results are means ± SEM (n = 3). **p < 0.001; *p < 0.05 (Student's paired t-test).