
Figure 3.
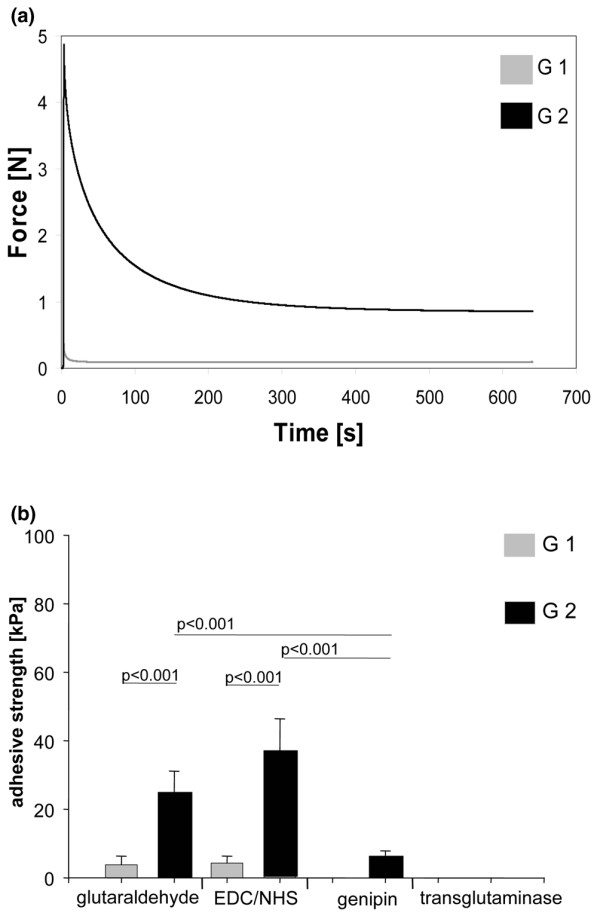
Stress-relaxation curves for the two sample geometries and bonding dependence on compression. (a) Stress-relaxation curves for the sample geometries G1 and G2 (see Figure 1e) were determined in a standardised creep modulus set-up. Samples were compressed by a stamp and the resulting force relaxation behaviour was analysed by recording the load over time. (b) G1 (almost no compression) or G2 (compression) cartilage blocks were subjected to different cross-linkers (without degrading pre-treatment). Adhesive strength as a measure of bonding was determined immediately after cross-linking. Bars represent the mean with standard error of the mean of at least 16 samples derived from 4 independent experiments, each with at least 4 replicates per group. P values in the graph are from pairwise comparisons using the Mann Whitney-U test. EDC, 1-ethyl-3-diaminopropyl-carbodiimide; NHS, N-hydroxysuccinimide.