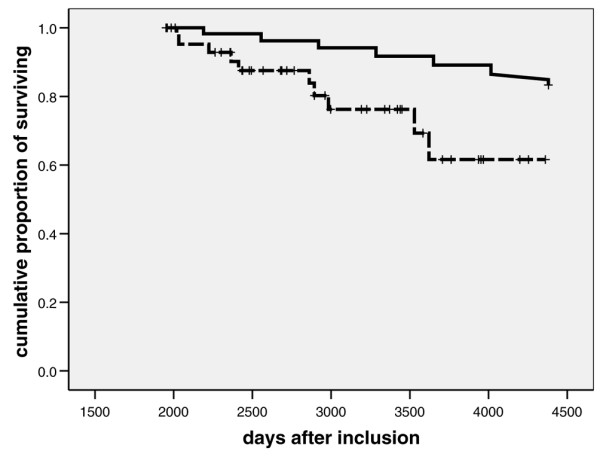
Figure 3.

Twelve-year survival: patients who have already survived longer than five years versus general population. Presented are Kaplan-Meier plots showing 12-year survival rates (after inclusion) in patients having already survived for more than five years (dashed line) and in the German general population (continuous line; data from Statistisches Bundesamt Wiesbaden, Germany [30]). P < 0.001 versus reference population of 1,000 individuals
