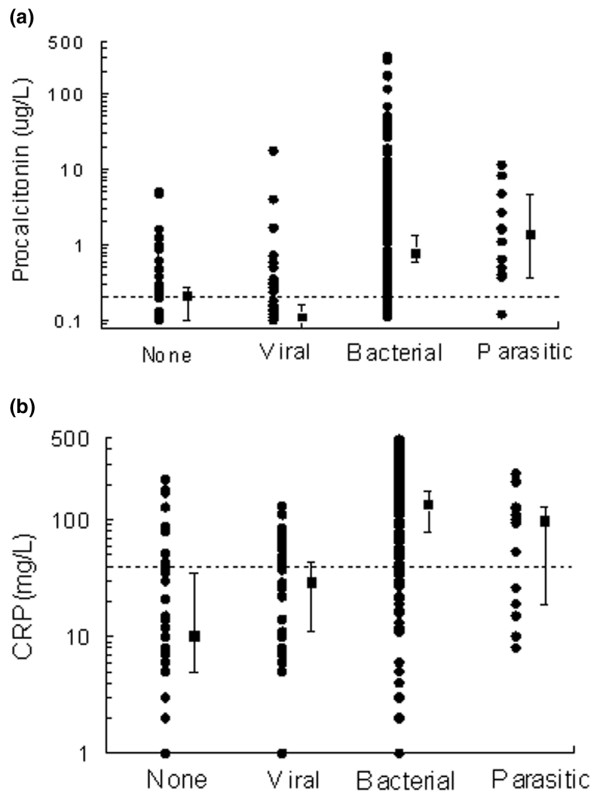
Figure 2.

Values of biomarkers in the different febrile groups: none (noninfectious), and viral, bacterial and parasitic infections. (a) Procalcitonin (PCT). (b) C-reactive protein (CRP). Data are presented in a semi-logarithm scale. Each dark circle indicates a patient. Dark squares represent medians (95% confidence interval) and dotted lines the optimal threshold determined on receiver operating characteristic curve: 0.2 μg/l for PCT and 40 mg/l for CRP.
