
Figure 1.
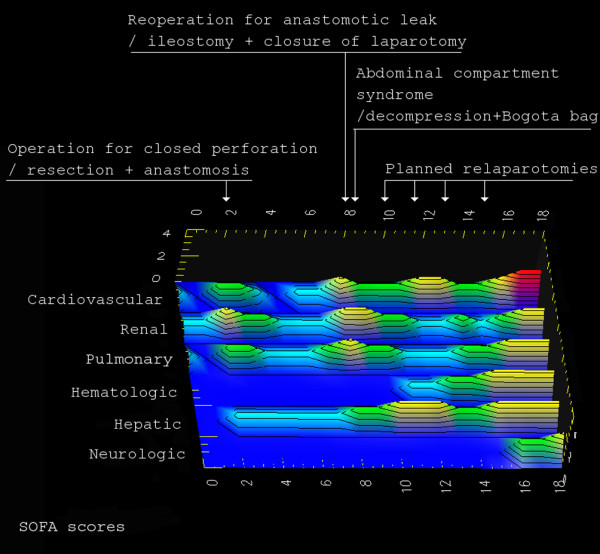
Graphical representation of SOFA scores. Shown is a graphical representation of the evolution over time in Sequential Organ Failure Assessment (SOFA) scores: a 'stormy' intensive care unit course ending with a 'tsunami'.
Official websites use .gov
A
.gov website belongs to an official
government organization in the United States.
Secure .gov websites use HTTPS
A lock (
) or https:// means you've safely
connected to the .gov website. Share sensitive
information only on official, secure websites.
Graphical representation of SOFA scores. Shown is a graphical representation of the evolution over time in Sequential Organ Failure Assessment (SOFA) scores: a 'stormy' intensive care unit course ending with a 'tsunami'.