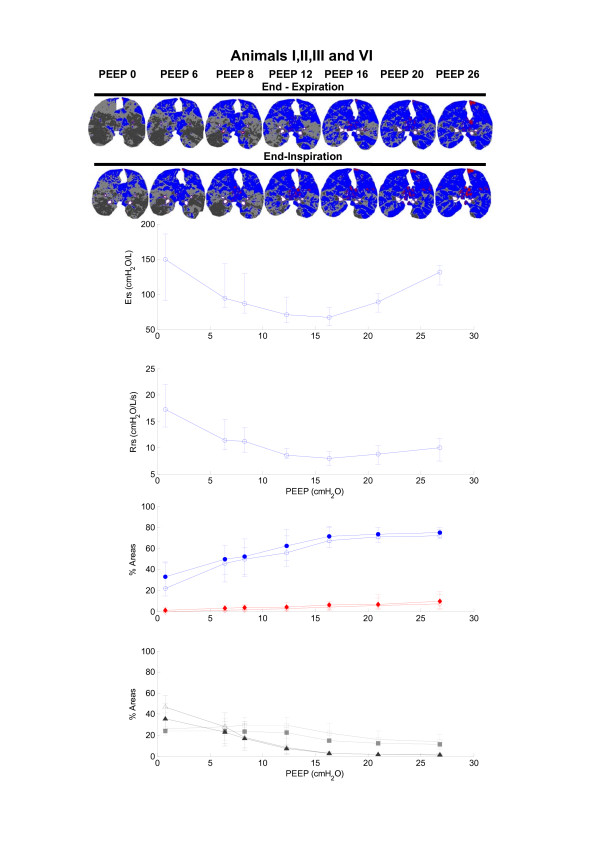
Figure 2.
Ers, Rrs and morphological analysis of the CT scans during PEEP titration for animals I, II, III and VI. The median and range of Ers and Rrs, and the distribution of lung aeration are plotted as a function of PEEP. Red diamonds indicate hyperinflated areas, blue circles indicate normally aerated areas, light grey squares indicate poorly aerated areas, and black triangles indicate non-aerated areas. The filled and open symbols indicate lung aeration changes at end-inspiration and end-expiration, respectively. Regions of interest on the CT scan images obtained during the PEEP titration in a representative case (animal I) are also presented in the upper panel. Aeration titration in a representative case (animal I) are also presented in the upper panel. Aeration status is colour coded in the images. Red indicates hyperinflated areas, and blue, light grey and black indicate normally aerated, poorly aerated and non-aerated areas, respectively. CT, computed tomography; Ers, respiratory system elastance; PEEP, positive end-expiratory pressure; Rrs, respiratory system resistance.

