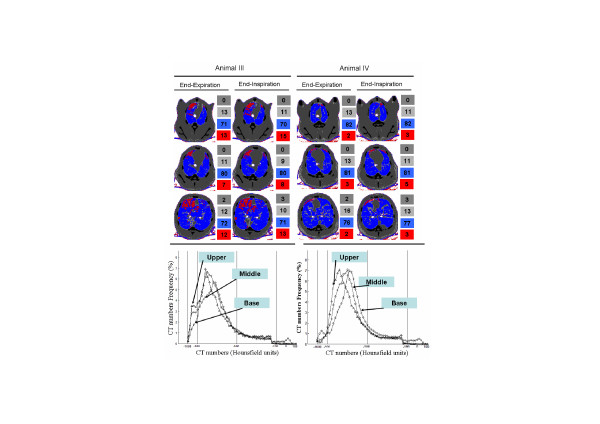
Figure 5.
Comparative changes in lung aeration at different anatomic levels. Images from the apex to diaphragm level during an end-expiratory pause and an end-inspiratory pause for two studied animals (left and right columns). The computed tomography (CT) scans were acquired near the lung hilus (upper), near the carina (middle) and at juxta-diaphragmatic (lower) levels; the respective histograms of density are also shown (bottom).

